Robert Pottle
What once was commonly known as RtI, or Response to Intervention is now know by many names. No matter what it is called there are many various intervention models. Most only vary slightly. Some vary not in practice, but in visual representation. I am going to offer another variation, not in the interest of adding to the numerous models available, but in the interest of sharing the model that is used in conjunction with the RAPID Charts.
Below is a visual representation of the intervention model used in conjunction with the RAPID Charts. Since this model is used in conjunction with the RAPID Charts, this intervention model is referred to as the RAPID Intervention Model (RIM)
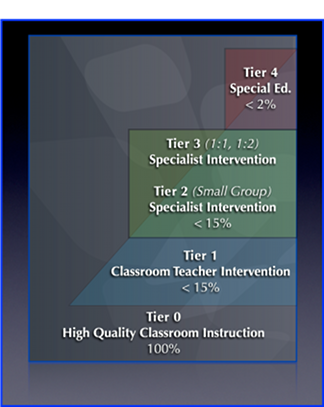
Tiers: The Levels of Intervention
The RAPID Intervention Model is grouped into “tiers” as many such models are. One difference with the RIM is the addition of a “tier 0.” Tier 0 is to represent the high quality classroom instruction all students are to receive. It is easy for a school to develop the misconception that once a student receives an out of classroom intervention, in reading for example, that the student no longer receives classroom instruction from the classroom teacher. The RIM utilizes a Euler diagram to visually represent the fact that all students receive tier 0, high quality classroom instruction, in addition to any intervention they might receive.
Tier 1 of the RIM consists of those interventions performed by the classroom teacher in the classroom. These are often instructional changes made in an attempt to bring the learner up to benchmark. These instructional changes, in reading for example, may include increased quantity of reading instruction, reading instruction conducted in teacher student ratios of 1:3, 1:2, or 1:1, multiple reading instruction sessions throughout the day, and/or highly targeted instruction. All of these instructional changes in tier 1 are conducted in the classroom, by the classroom teacher. In the above RIM representation, all of tier 1 overlaps tier 0 to show that all students receiving a tier 1 intervention are also receiving high quality classroom instruction.
The idea of grouping tiers 2 and 3 together is borrowed from Dorn and Soffos’ Comprehensive Intervention Model (2011). Both tiers 2 and 3 are performed by specialists other than the classroom teacher in addition to the regular classroom reading instruction. This specialist should have at least as much training in reading instruction as the classroom teacher, preferably more. The difference between the tiers 2 and 3 is the ratio of teacher to student. In tier 2 the ratio is 1:3 or greater. Tier 2 is often referred to as a small group intervention. In tier 3 the ratio is smaller often 1:1, but sometimes 1:2 if the skills to be targeted are similar enough.
The rational behind grouping these two tiers together came in large part to Reading Recovery interventions provided in first grade. Often times a first grader will qualify for a Reading Recovery intervention, which would typically be a 1:1, tier 3 intervention, without yet having received a small group, tier 2 intervention. The RIM acknowledges that moving from a tier 1 intervention to a tier 2 or 3 intervention may or may not be sequential. In other words a student in tier 1 of the RIM who needs an intervention at a higher tier may next receive either a tier 2 or a tier 3 intervention.
The Euler diagram representation of the RIM shows that all students receiving tier 2 and 3 interventions also receive tier 0 of high quality classroom instruction. The intervention is always in addition to the classroom instruction. This representation of the RIM also shows that many, but not all students in tiers 2 and 3 also receive tier 1 instruction. This decision is based on the needs of the learner as determined by the data driven discusions of the intervention team.
The final tier in the RIM is tier 4 or Special Education. Again, learners in tier 4 receive tier 0 instruction and may or may not receive tier 1 instruction.
The percentages listed for each tier are used to monitor classroom instruction on a school-wide level. If more than 20% of the school population requires an intervention then there is problem with the instruction at tier 0 that must be addressed (Allington, 2009). It is important to look at this a this 20% figure at a school wide level. At the classroom level, the population is small enough that the percentages are easily skewed by anomalies. At the grade level, the numbers may be skewed by instructional structures purposefully constructed. An example of this would be Reading Recovery intervention which typically occurs during grade one. Because of this, schools with Reading Recovery, may see percentages higher than 20% in first grade. For the above reasons, it is best to monitor the 20% standard at the school-wide level.
The RIM representation above is useful to see how the various tiers may overlap, and the structure of each tier. However, it does not show the movement between tiers - and there should be movement. The RIM is designed to avoid having learners who receive intervention their entire school careers, sometimes referred to as “lifers.” If a given intervention is not producing accelerated learning in a student, then the intervention is to be modified until it does.
The diagram below maps the various paths between the different tiers.
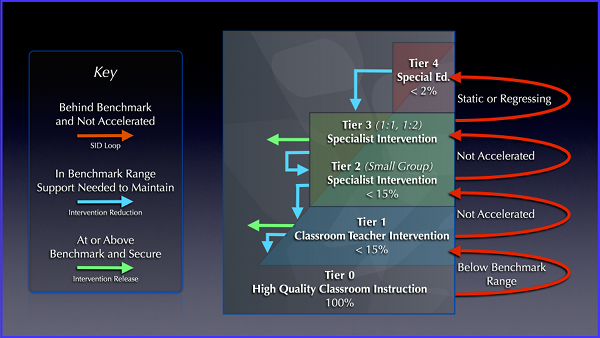
There are three types of movement between tiers. The first movement, represented by a red line above, is for increases in the level of intervention. This occurs when a student is below benchmark range and acceleration is not occurring. When this is the case, either the current tier must be reexamined or the student is moved into a higher tier.
The second type of movement occurs when acceleration is evident and the student is within benchmark range, but it is not known if the learner will be able to maintain their position in benchmark range if released to receive only tier 0 instruction. In this case, the level of intervention is decreased, represented by the blue line above. This may come in the form of reducing the quantity of the current tier or by reducing the level of intervention by moving them to a lower tier.
The final possible path of movement, represented by the green line above, occurs when a learner, who is currently receiving an intervention, reaches or exceeds benchmark, and appears as if this learner can maintain growth that will keep them at or above benchmark. In this case, the learner is released from the current their current tier to tier 0, or regular high quality classroom instruction. This movement is represented by the green path.
Allington, R. (2009). What really matters in response to intervention: Research-based designs. Boston: Allyn & Bacon.
Dorn, L., & Soffos, C. (2011). Interventions that work: A comprehensive intervention model for preventing reading failure in grades k-3. Boston: Allyn & Bacon.
© 2014, Robert Pottle

- Menu
RAPID Progress Navigation Menu
Data Entry/Info.
- Create a RAPID Chart
- Text Level Entry
- Information
- Philosophy
- Introduction
- Documentation
Screencasts
Diagrams
Articles
- Intervention Model
- BIG Reports
- pdf file
- as a web page
Contact
- Phone:
- 330 R POTTLE
- E-mail Form
For Best Results
Conduct running record on second read.
Enter the highest text level that can be read with 95% - 98% accuracy.
Text levels are Fountas & Pinnell levels.
Select start and end points for data analysis.
Hover cursor over areas that turn turquoise for additional tips.
Use the materials here as a starting point for your intervention decisions.
Data, on its own, does not change anything.
Actions taken based upon flawed data analysis can be more damaging than the status quo.
Accurate data analysis and effective actions based upon that analysis can reliably lead to accelerated learning.